
Disability Profile - Galway City
Issued on October 22 2024
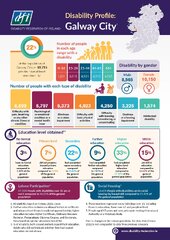
Disability Profile[1]: Galway City
22% of the population, or 18,715 number of people, have at least one disability
8,565 males, and 10,150 females have at least one disability
1,231 people 0-14 years old have a disability
3,615 people 15-24 years old have a disability
4,991 people 25-44 years old have a disability
4,313 people 44-65 years old have a disability
4,565 people over 65 have a disability
Type of Disability
6,899 people have difficulty with pain, breathing or any other chronic illness or condition
4,923 people have difficulty with basic physical activities
5,797 people have a psychological or emotional condition or a mental health issue
5,373 people have blindness or a vision impairment
3,225 people have Deafness or a hearing impairment
4,250 people have difficulty with learning, remembering or concentrating
1,574 people have an intellectual disability
Education Level Obtained[2][3]
3% of people with disabilities had no formal education, compared to 1.30% of the general population
7% of people with disabilities had only a primary school education, compared to 3.22% of the general population
22% of people with disabilities had only a secondary school education, compared to 16.86% of the general population
9% of people with disabilities had completed further education, compared to 7.87% of the general population
33% of people with disabilities had completed higher education, compared to 37.09% of the general population
15% of people with disabilities were still in education, compared to 16.02% of the general population
37.51% of people with disabilities over 15 are in employment[4], compared to 46.31% of the general population
16.61% of people with disabilities are in social housing[5] (by household) compared to 11.41% of the general population
Due to changes in the census questions, the data from Census 2022 is not comparable to data from previous censuses
[1] All statistics based on Census 2022, cso.ie
[2] Further education includes vocational/technical certificate and advanced certificate/completed apprenticeship, higher education includes Higher Certificate, Ordinary/Honours Bachelor, Postgraduate Diploma/Degree, and Doctorate. Data based on special tabulation from CSO.
[3] % of all adults, both ceased and not ceased their education. Adults who did not indicate whether they had ceased education are not shown.
[4] These numbers represent every individual over 15, including those in education, those over 65 and people retired.
[5] People aged 15 years and over, who were renting from a Local Authority or a Voluntary Body.