
Disability Profile - Galway County
Issued on October 22 2024
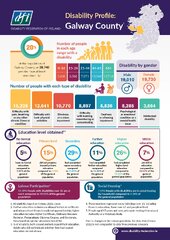
Disability Profile[1]: Galway County
20% of the population, or 38,740 people, have at least one disability
19,010 males, and 19,730 females have at least one disability
3,436 people 0-14 years old have a disability
3,566 people 15-24 years old have a disability
7,071 people 25-44 years old have a disability
10,949 people 44-65 years old have a disability
13,718 people over 65 have a disability
Type of Disability
15,228 people have difficulty with pain, breathing or any other chronic illness or condition
12,641 people have difficulty with basic physical activities
8,285 people have a psychological or emotional condition or a mental health issue
10,770 people have blindness or a vision impairment
8,836 people have Deafness or a hearing impairment
8,897 people have difficulty with learning, remembering or concentrating
3,664 people have an intellectual disability
Education Level Obtained[2][3]
5% of people with disabilities had no formal education, compared to 2.05% of the general population
15% of people with disabilities had only a primary school education, compared to 6.93% of the general population
29% of people with disabilities had only a secondary school education, compared to 25.85% of the general population
11% of people with disabilities had completed further education, compared to11.31% of the general population
26% of people with disabilities had completed higher education, compared to 33.26% of the general population
7% of people with disabilities were still in education, compared to 10.93% of the general population
33.49% of people with disabilities over 15 are in employment[4], compared to 48.50% of the general population
7.19% of people with disabilities are in social housing[5] (by household) compared to 4.36% of the general population
Due to changes in the census questions, the data from Census 2022 is not comparable to data from previous censuses
[1] All statistics based on Census 2022, cso.ie
[2] Further education includes vocational/technical certificate and advanced certificate/completed apprenticeship, higher education includes Higher Certificate, Ordinary/Honours Bachelor, Postgraduate Diploma/Degree, and Doctorate. Data based on special tabulation from CSO.
[3] % of all adults, both ceased and not ceased their education. Adults who did not indicate whether they had ceased education are not shown.
[4] These numbers represent every individual over 15, including those in education, those over 65 and people retired.
[5] People aged 15 years and over, who were renting from a Local Authority or a Voluntary Body.