
REGION Dublin and the North East
Issued on February 14 2025
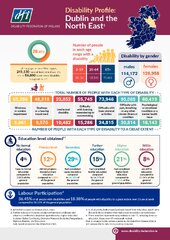
Region: Dublin and North East[1]
- 241,130 people in this region have at least one disability, while 86,860 experience disability to a great extent.
- 114,172 males and 126,958 females in this region have at least one disability.
Age Breakdown
- 35,124 people in this region aged 0-19 years have a disability.
- 135,513 people in this region aged 20-64 years have a disability.
- 70,493 people in this region over 65 have a disability.
Type of Disability
- 95,065 people in this region have difficulty with basic physical activities.
- 73,946 people in this region have a psychological or emotional condition or a mental health issue.
- 24,815 people in this region have blindness or a vision impairment.
- 55,745 people in this region have Deafness or a hearing impairment.
- 65,098 people in this region have difficulty with learning, remembering, or concentrating.
- 48,318 people in this region have an intellectual disability.
Education Level Obtained[2][3]
- 4% of people with disabilities have no formal education compared to 2.01% of the general population.
- 12% of people with disabilities did not progress beyond primary education compared to 5.88% of the general population.
- 29% of people with disabilities had completed upper secondary compared to 24.78% of the general population.
- 15% of people with disabilities had completed further education compared to 14.77% of the general population.
- 21% of people with disabilities had completed higher level education compared to 27.05% of the general population.
- 8% of people with disabilities are still in education compared to 11.04% of the general population.
Labour Participation[4]
- 36.45% of all people with disabilities and 18.38% of people with disability to a great extent over 15 are at work, compared to 58.10% of the general population.
[1] All statistics based on Census 2022, cso.ie
[2] Further education includes vocational/technical certificate and advanced certificate/completed apprenticeship, higher education includes Higher Certificate, Ordinary/Honours Bachelor, Postgraduate Diploma/Degree, and Doctorate. Data based on special tabulation from CSO.
[3] % of all adults, both ceased and not ceased their education. Adults who did not indicate whether they had ceased education are not shown.
[4] These numbers represent every individual over 15, including those in education, those over 65 and people retired. Due to changes in the census questions, the data from Census 2022 is not comparable to data from previous censuses.